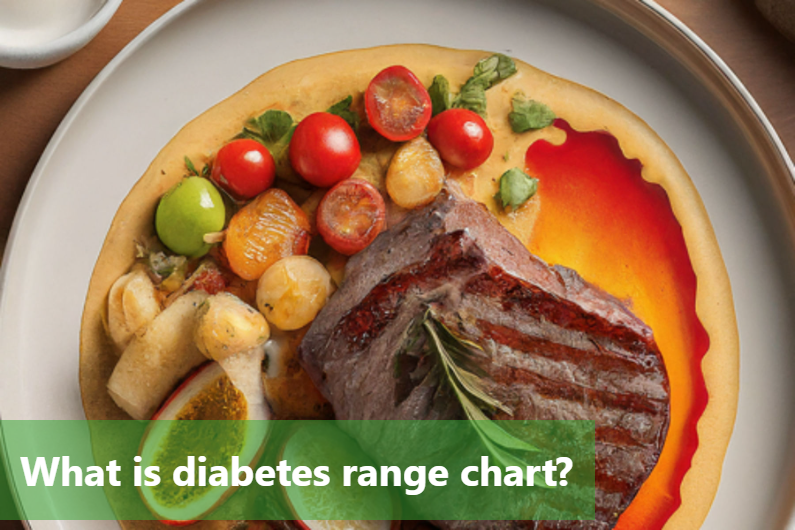

A diabetes range chart is a helpful tool for people managing diabetes.It shows the target ranges for blood sugar levels and HbA1c measurements in a visual way.It helps people know and keep an eye on their glucose control, so they can make smart choices about their treatment and lifestyle. The chart usually has different ranges like normal, pre-diabetic, and diabetic levels, which lets users check and follow their progress. This tool is important for doctors and patients, making it easier for them to talk and work together on good management plans.
Understanding the Diabetes Range Chart
When you want to understand the diabetes range chart, it's important to know the meaning of the different numbers and measurements it includes. This chart is a useful tool for people to keep track of and control their diabetes properly.

The first important part of the diabetes range chart is blood sugar levels. This tells you how much glucose is in your blood at a certain time. By knowing these levels, people can make smart choices about their food, medicine, and overall diabetes control.
HbA1c, another important part, shows a person's average blood sugar levels over the past two to three months. This long-term indicator is very important for checking if the strategies and treatment plans for diabetes are working well.
Blood Glucose Levels (mg/dL)
|
Type |
Fasting Blood Sugar |
After Eating (Postprandial) |
HbA1c |
|---|---|---|---|
|
Normal |
Below 100 |
Below 140 |
Below 5.7% |
|
Prediabetes |
100-125 |
140-199 |
5.7%-6.4% |
|
Diabetes |
126 and above |
200 and above |
6.5% and above |
Age Considerations:
-
For children and teens with type 1 diabetes, target ranges may be adjusted based on individual circumstances and growth stages. Typically, management is stricter to avoid complications.
-
Adults with type 2 diabetes often follow similar ranges, though adjustments may be made based on age-related health considerations.
Additionally, the chart also shows the ideal ranges for both blood sugar levels and HbA1c. This gives people clear goals to aim for in their diabetes control, making sure that they stay within healthy limits and lower the chance of problems.

Understanding the diabetes range chart gives people the power to take control of their health. By learning about these numbers and measurements, they can make smart choices, get timely medical help, and actively manage their diabetes to live a healthy and satisfying life.
Interpreting the Diabetes Range Chart
-
The diabetes chart shows important information about blood sugar levels and HbA1c measurements. It usually has different sections for fasting blood sugar, blood sugar after eating, and HbA1c levels.
-
Fasting blood sugar levels show the amount of glucose in the blood after not eating for a while. It helps to understand the usual blood sugar levels and make changes to medication.
-
Postprandial blood sugar levels show how the body handles glucose after eating. This information can help in deciding what to eat and how much insulin to take.
-
HbA1c reflects the average blood sugar levels over the last two to three months. It is important to check how well diabetes is managed and the risk of complications.
-
Reading the diabetes chart means comparing the numbers with the recommended ranges by healthcare professionals. This helps to make important changes to medication, diet, or exercise.
-
Understanding the numbers and ranges in the diabetes chart helps people make better decisions about their diabetes. This leads to better health.
Diabetes Range Chart Colors Explained

When it comes to diabetes range charts, different colors are often used to represent various blood glucose levels. Here's a breakdown of what each color signifies:
-
Green: Green typically represents the normal or target range for blood glucose levels. This is the range that individuals with diabetes aim to maintain to ensure good health and well-being.
-
Yellow: Yellow is often used to indicate caution. In a diabetes range chart, yellow may represent levels that are slightly outside the target range but not yet at a critical level. It serves as a signal to pay closer attention and take appropriate action to prevent levels from escalating.
-
Red: Red is commonly associated with danger or high alert in a diabetes range chart. It indicates blood glucose levels that are too high and require prompt intervention. These levels may pose immediate health risks if left unmanaged.
Understanding the meanings behind the colors used in a diabetes range chart can help individuals with diabetes and healthcare professionals effectively monitor and manage blood glucose levels, ultimately contributing to better health outcomes.
Utilizing the Diabetes Range Chart for Management
The diabetes range chart is a powerful tool for managing diabetes effectively. It provides valuable insights into our blood sugar levels, HbA1c, and target ranges, helping us take necessary actions to maintain optimal health. Here are some tips and strategies to make the most of this essential resource:
-
Regular Monitoring: Regularly check your blood sugar levels and note them on the range chart. This will help you track patterns and understand how your body responds to different foods, activities, and medications.
-
Set Personal Targets: Work with your healthcare provider to establish personalized target ranges based on your age, lifestyle, and overall health. By doing so, you can tailor your management plan to meet your specific needs.
-
Lifestyle Adjustments: Use the range chart as a guide to make lifestyle changes. For instance, if your chart indicates consistently high blood sugar levels after certain meals, you may need to adjust your diet to include more low glycemic index foods. Regular exercise can also impact your numbers, so note your activity level on the chart as well.
-
Medication Management: If you are on medication, the range chart can help you and your healthcare provider determine if any adjustments are necessary. It can also indicate if certain medications are not effectively controlling your blood sugar levels.
-
Seek Professional Guidance: Always consult with your healthcare provider when making significant changes to your diabetes management plan. They can provide valuable insights and ensure that your adjustments are safe and effective for your individual situation.
By utilizing the diabetes range chart for management, you can gain better control over your diabetes and make informed decisions to lead a healthier life.
To conclude:
The diabetes chart is very important for people with diabetes. It helps them keep track of their sugar levels. It gives clear and easy-to-understand guidelines and goals to help people make good choices about their food, lifestyle, and medicine. Doctors also use it to make sure people are getting the right treatment. In summary, the diabetes chart is very helpful for people with diabetes. It gives them guidance, support, and a way to manage their condition better.

FAQs:
-
What do the different colors on the diabetes range chart indicate?
-
The different colors on the diabetes range chart represent the various blood glucose levels, such as normal, pre-diabetes, and diabetes.
-
How often should I refer to the diabetes range chart?
-
It is recommended to refer to the diabetes range chart whenever you check your blood sugar levels, especially if you are managing diabetes or at risk of developing it.
-
What should I do if my blood glucose level falls outside the range shown on the chart?
-
If your blood glucose level falls outside the range shown on the chart, consult with your healthcare provider for guidance on any necessary adjustments to your treatment plan.
-
Can the diabetes range chart be used for both type 1 and type 2 diabetes?
-
Yes, the diabetes range chart can be used for both type 1 and type 2 diabetes as it provides a general guideline for blood sugar levels.
-
Where can I find more detailed information about interpreting the diabetes range chart?
-
For more detailed information about interpreting the diabetes range chart, consult with a diabetes educator or your healthcare provider. They can provide personalized guidance based on your individual health needs.
This Blog post is an initiative by DiabeSmart, to provide accurate and Nutritionist / Doctor approved information related to Diabetes. DiabeSmart is India's first Food brand designed specifically for Diabetics, that has been clinically tested on Diabetics and Pre-Diabetics to deliver 55% - 70% lower Sugar spikes. DiabeSmart is part of Lo! Foods - India's leading brand for Everyday Functional Health foods.